Templates
Visual Summary Card Templates
Every template here is a finished example: a real piece of source text and the visual it produced, shown side by side so you can judge the compression before you spend anything. Pick the one closest to what you are summarising and it applies the same treatment to your own text.
Two families
Browse by what you are making
Knowledge Card Templates
A knowledge card takes one body of reading — a book, a chapter, a paper — and compresses it into a single image you can revise from. Below are four finished examples, each generated from real source text, and each one reusable with your own.
4 templatesExecutive Summary & One-Pager Templates
A one-pager exists because the document it summarises will get four minutes of attention. Below are four finished executive summary templates — a SWOT card, a post-mortem, a research summary and a launch roadmap — each generated from a real working document.
4 templatesAll 8 templates
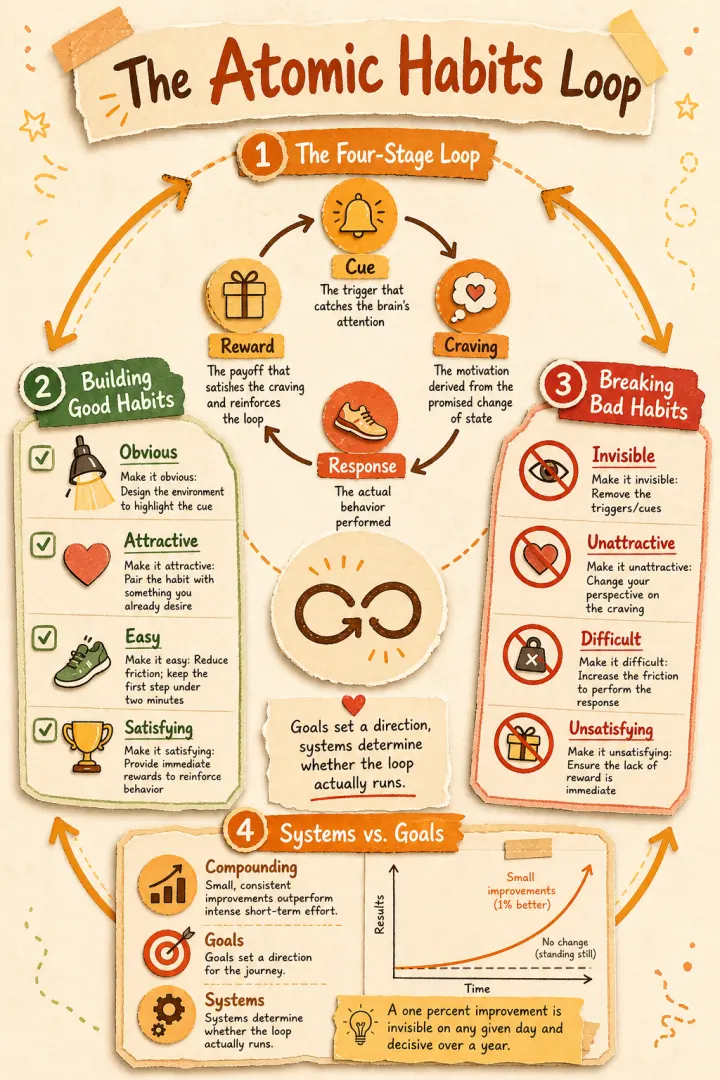
Atomic Habits — the habit loop
The four-stage loop as a closed cycle, with a law attached to each stage.
Use this template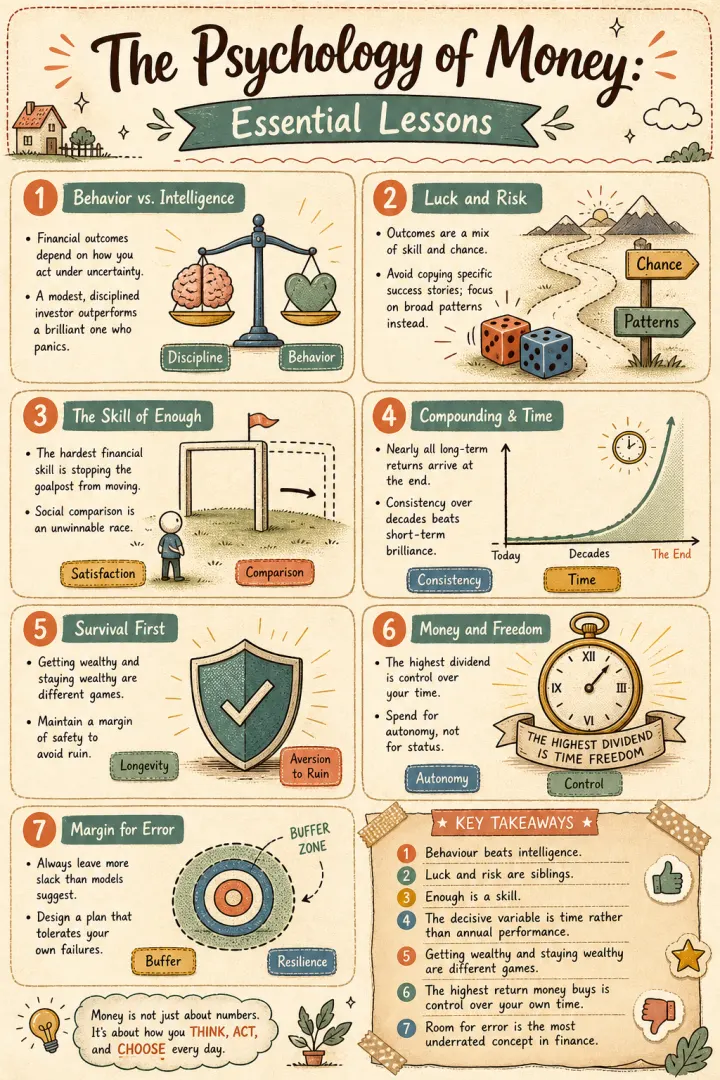
The Psychology of Money — key lessons
Parallel lessons as a modular grid, each tile standing on its own.
Use this template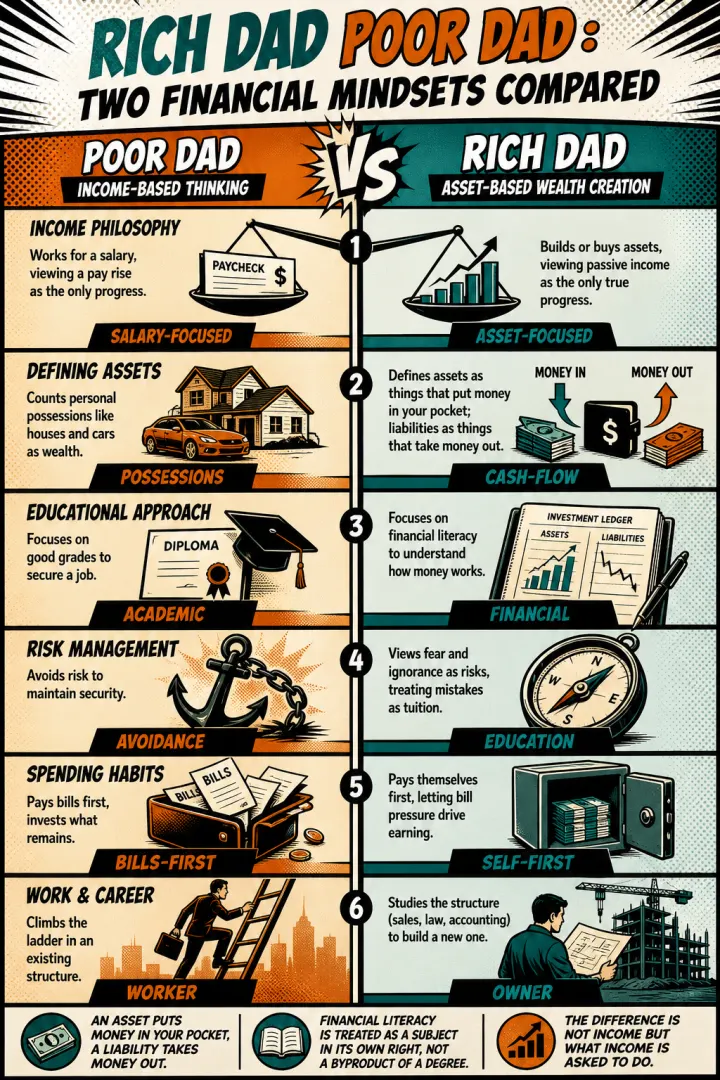
Rich Dad Poor Dad — two mindsets
A two-column contrast — the format the book's whole argument is built on.
Use this template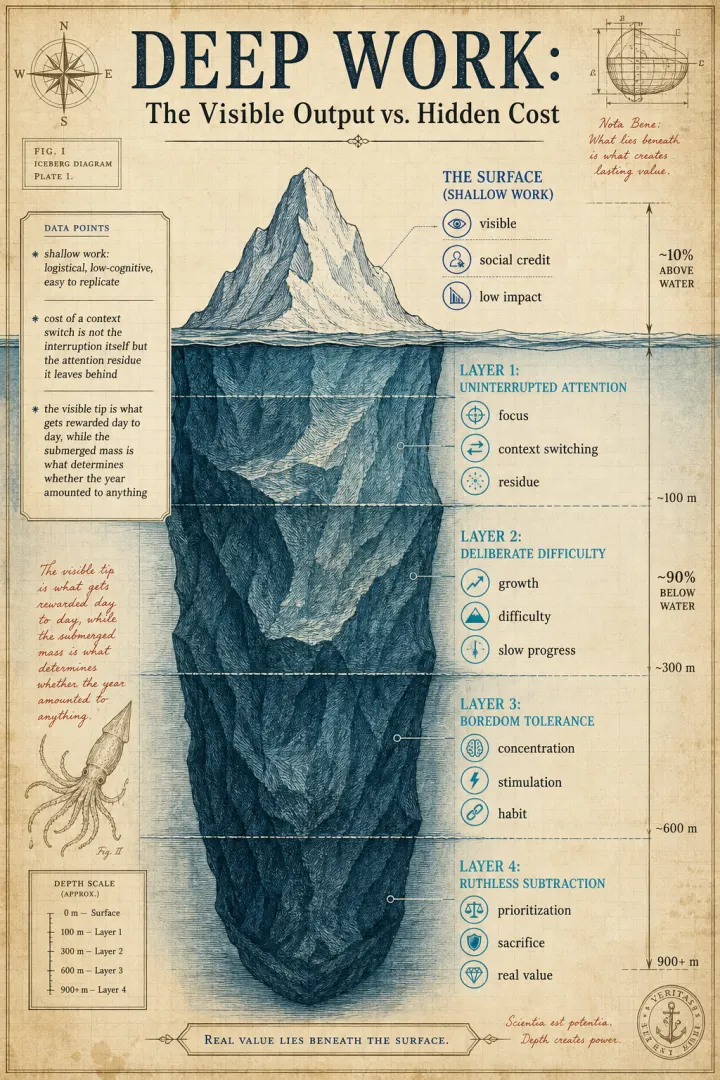
Deep Work — above and below the surface
An iceberg: visible shallow work over the four things that actually produce value.
Use this template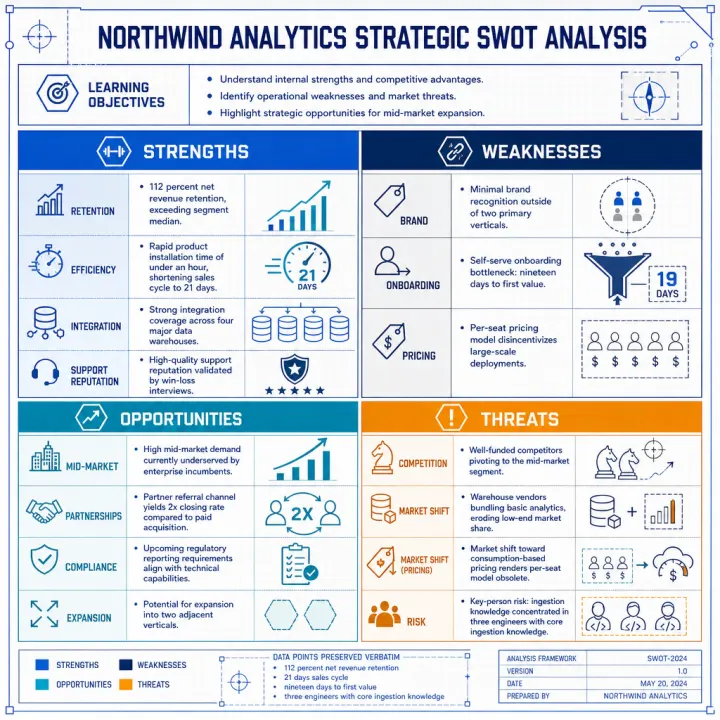
SWOT analysis — mid-market SaaS
Four quadrants from a real planning input, with the strategic read attached.
Use this template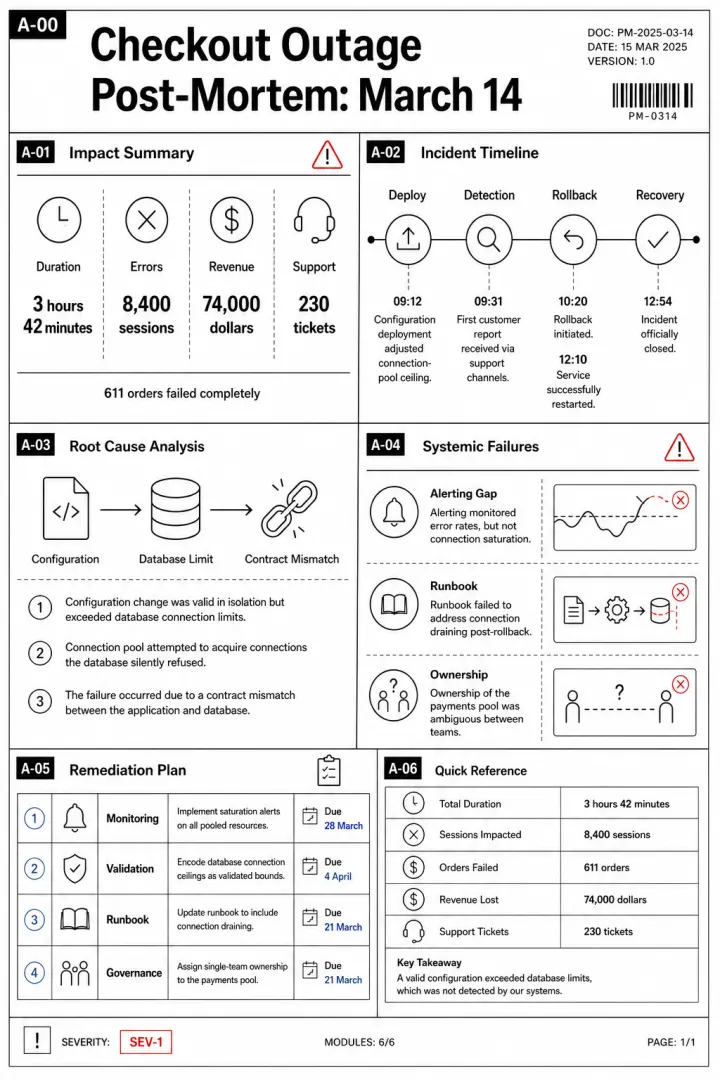
Post-mortem — checkout outage
Impact, timeline, root cause and owned actions on one page.
Use this template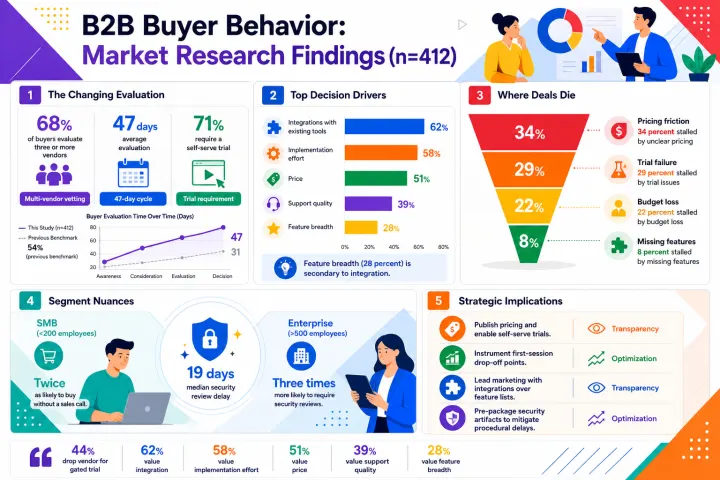
Market research — buyer survey findings
Survey findings as a dashboard: sample, drivers, and where deals die.
Use this template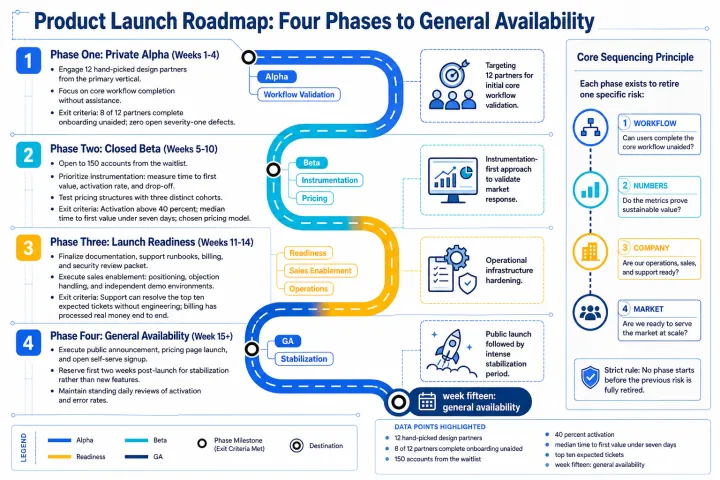
Product launch roadmap — four phases
Four phases as a route, each with the risk it exists to retire.
Use this templateWhat a template is in this template gallery
A template here is not a file you open and type into. It is a finished example plus the settings that produced it, and its button applies those same settings to text you paste. You do not choose anything about the design; you choose an outcome you have already seen and hand it different content.
That distinction matters for what you get. There is no canvas to nudge and no layers to rearrange — you hand over text and get back a finished PNG. The advantage is that the editorial compression is done for you and a whole series stays visually consistent for free; the cost is that fixes happen by adjusting your source text and generating again rather than by clicking into the image.
Every case page in this template gallery shows the source text that produced it, so you can see the ratio between what went in and what came out before you spend anything. That is deliberate: most template galleries show you the polished result and hide the input, which makes it impossible to judge whether the tool will work on the messy document you actually have.
How to choose between them
Pick by the shape of your argument, not by the subject. A template built for a book summary works perfectly well on a strategy memo if both have the same structure — one central mechanism with dependent factors, say, or two positions in opposition. The subject is what your text supplies; the structure is what the template contributes.
If you are unsure, the fastest route is to try finishing this sentence about your document: "the point is X, and it matters because Y." Whatever shape that sentence implies is the template to reach for. Content with a genuine sequence wants a route or a cycle; content with parallel findings wants a grid or a dashboard; content whose whole point is a contrast wants two columns.
- One idea with dependent factors → a hub, as in the knowledge-card examples
- A process that loops back on itself → a closed cycle
- Two opposed positions → a two-column contrast
- Independent readings and metrics → a dashboard of framed tiles
- Phases with real gates between them → a route
- Four quadrants compared → a matrix
Why the examples use real source text
Each of the eight examples was generated once, through the same pipeline anyone else uses, from source text written for the purpose — a few hundred words of ordinary prose with no special markup. Nothing was retouched afterwards and nothing was cherry-picked from a batch of attempts.
That has an honest consequence worth stating: generation varies between runs. Two of these examples put their emphasis somewhere slightly different from what the source text most stressed, and the pages say so where it happened. The structure is reliable; the exact emphasis is not guaranteed. Knowing that before you spend a credit is more useful than a gallery of perfect results would be.
It also means the ratio is visible. A 300-word input producing a card with twelve labelled elements tells you something concrete about how much compression to expect, which no amount of marketing copy can.
Not sure what you need?
Use any of them with your own text
Pick a template, paste your content, and the settings behind the example are applied for you. A free credit covers the first image.