Use cases
What people turn into visual summaries
The six pages below all make visual summaries, and they all start from the same problem — you have more text than anyone will read — but they end somewhere different, because what you need out of it depends on who is going to look at it. Pick the closest fit; each one ends in the workbench with its settings already applied.
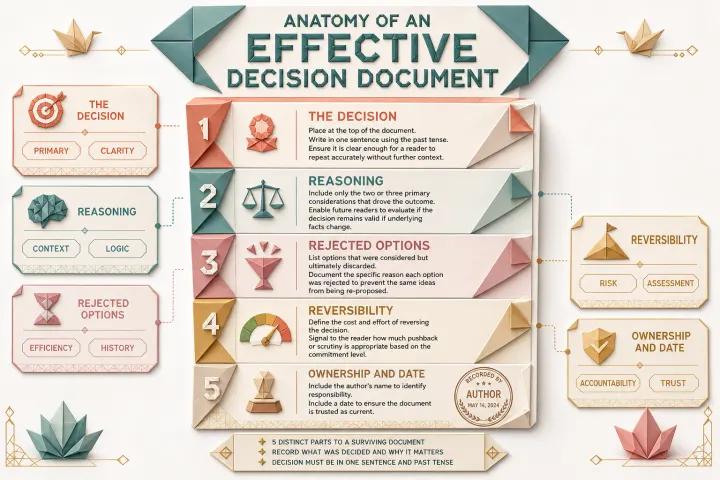
For anyone with more text than anyone will read
Text to Visual Summary — Any Document, One Image
The document is finished and nobody will read it
Read the workflow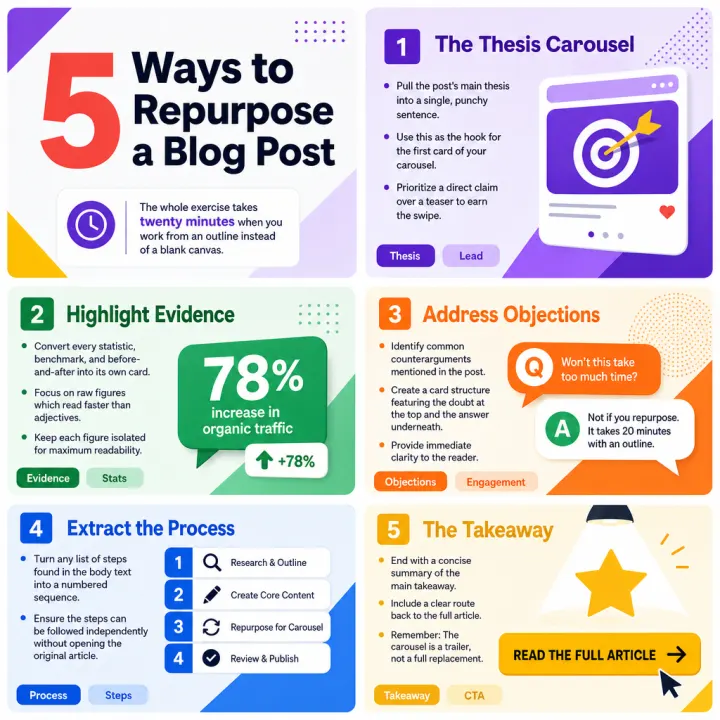
For content marketers, social teams & creators
Turn Long Articles & Blog Posts into Carousel Cards
Why repurposing eats a whole afternoon
Read the workflow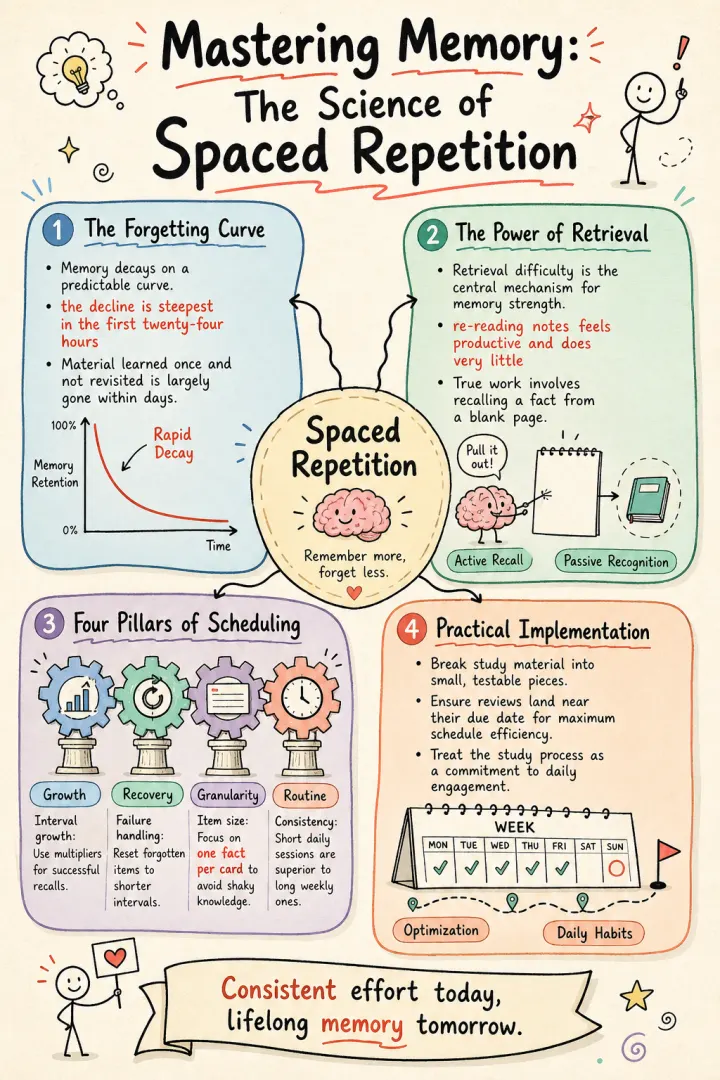
For students, researchers & note-takers
Distil Complex PDFs & Books into Visual Knowledge Cards
Why highlighting doesn't stick
Read the workflow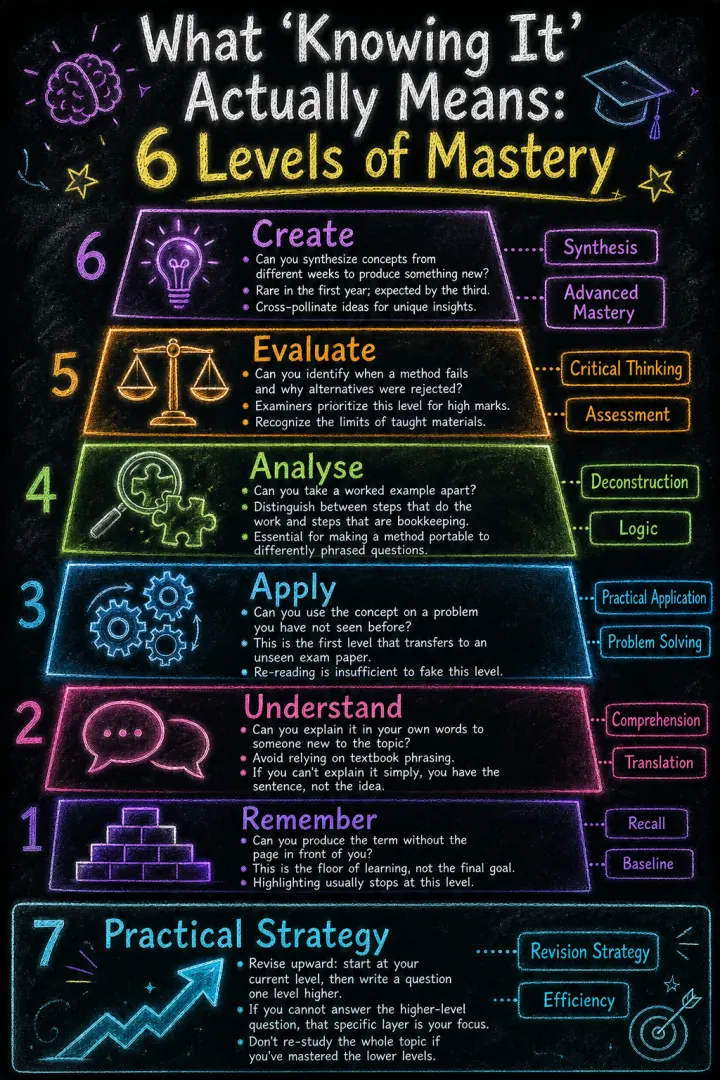
For students, teachers, trainers & note-takers
A Knowledge Card Generator for Notes, Lectures & Transcripts
The notes you took are not notes you can revise from
Read the workflow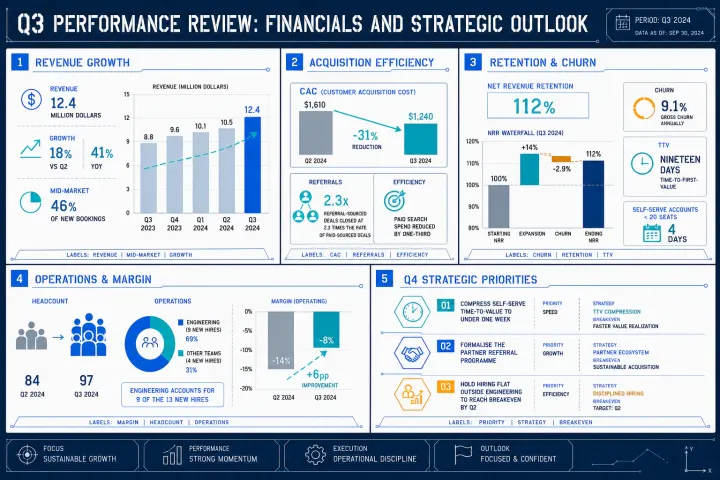
For analysts, consultants & operators
Transform Heavy Business Reports into One-Pager Visual Summaries
The report nobody opens
Read the workflow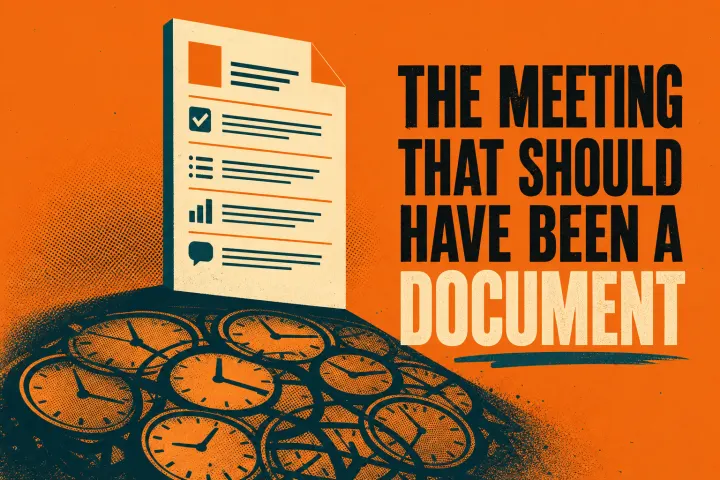
For bloggers, newsletter writers & content teams
Generate a Blog Header or Banner Image from the Article Itself
The image everyone sees and nobody has time to make
Read the workflowOne general page, four that replace reading, one that starts it
The first page is the general case. It starts from the input rather than the output — you have a document, you are not yet sure what picture you want out of it — and it ends by handing you to whichever of the others fits. Start there if you have not done this before; it is also the page that says plainly when none of this is the right tool.
The four in the middle are the same job with different readers. A carousel wants parallel panels and a claim that earns the first swipe. A knowledge card wants one centre with its dependencies around it, terse enough to revise from — and there are two of those pages because the hard part differs: distilling a document you must get through is not the same problem as finding structure in notes that never had any. A one-pager wants framed readings a busy person can take in cold. In all four, the image is a substitute for the document.
The banner is the opposite. It carries one idea and its only measure of success is whether somebody opens the article — so detail actively hurts it, where in the other four detail is the entire point. Worth knowing which of the two you are making before you start, because the same source text can produce either and they fail in opposite directions.
What these jobs have in common
Visual summaries are quick to admire and slow to make, and in all of these the expensive work is subtraction. The writing already exists — an article, a paper, a thirty-page review — and what stands between it and a usable visual is deciding which few things survive and how they relate. That editorial judgement is what design tools leave with you and what templates quietly fail to help with, because a template is a frame rather than a decision.
It is also why the input length matters more than the subject. If your source is longer than your output, generating from the text is doing real work for you. If your source is a headline and a logo, there is nothing to compress and a design editor will be faster — worth saying plainly, since it decides whether any of these three pages is relevant to you at all.
The second thing they share is repetition. None of these jobs is a one-off: the social team publishes weekly, the student reads a chapter a week, the analyst files a review every month, the blogger ships a post. That changes what "good" means. A single striking image matters less than a format that reproduces — which is why each page fixes its whole look in one go rather than leaving it to be re-decided every week.
Choosing between them
If you are not sure which page applies, choose by where the output has to live rather than by your job title. That is the variable that actually constrains the design.
- Not decided yet, or new to this → start with the general page
- Into a feed, read at thumb speed → carousel cards
- Out of a PDF or paper you have to get through → a knowledge card from the document
- Out of lecture notes, a transcript or a meeting → a knowledge card built from scratch
- Into a deck, an email or the top of a document → a one-pager
- Above the article, to make someone open it → a banner
These are not exclusive. The same source document can produce a one-pager for the leadership review, a carousel for the announcement and a banner for the post that carries it — three generations, one input.
What none of these do
Worth being direct about the limits, because they are the same on every page here. You get a finished image, not an editable canvas: there is no clicking into a heading to fix a word. When something is wrong the loop is to adjust the source text, or switch the structure, and generate again — which is fast when the problem is editorial and irritating when it is cosmetic.
Nor are visual summaries a substitute for reading the output. These are generated, so a figure can come through subtly wrong and a card can put its emphasis somewhere the source did not. Anything that leaves your own notes deserves a thirty-second check against the document it came from. That is a small tax, and it is not optional on a page carrying numbers to a leadership review.
Finally, there is no data connection. Figures are read from the text you paste, never pulled from a spreadsheet or a live dashboard, and nothing here plots a dataset. Keep real charts as charts; use these for the argument around them.
Or start from a finished example
Start with your own text
Paste an article, drop a PDF, or hand over a URL. A free credit gets your first visual summary.