For analysts, consultants & operators
Transform Heavy Business Reports into One-Pager Visual Summaries
Flowgraph works as a business report to one-pager AI: paste the quarterly review, the market study or the diligence memo, and it returns a single visual summary — the headline numbers framed as tiles, the movements labelled, the priorities called out — the page that actually gets read before the meeting.
Before / after
The same content, twice
What you have
A quarterly review, thirty pages
Q3 performance review — internal summary
Revenue for the quarter reached 12.4 million dollars, up 18 percent against Q2 and 41 percent year over year. Growth came disproportionately from the mid-market segment…
Customer acquisition cost fell to 1,240 dollars from 1,610 dollars, largely because paid search spend was cut by a third and reallocated to content and partner referrals…
Net revenue retention held at 112 percent. Gross churn rose slightly to 9.1 percent annually, concentrated almost entirely in accounts under twenty seats…
What comes back
One landscape one-pager
- Headline metrics framed as separate tiles, each readable in a second
- Direction and delta attached to every figure, not left implied
- The concentration of churn called out rather than buried in a clause
- Next-quarter priorities carried through as their own block
The report nobody opens
The work is sound and thirty pages long, and the people it was written for will spend four minutes with it. So somebody builds a summary slide by hand: copy the figures across, hunt for last quarter's deck to match the formatting, rebuild the chart that no longer fits, and discover an hour later that the numbers on the slide and the numbers in the appendix have quietly diverged.
That last part is the real cost. A hand-built summary is a second copy of the data, and second copies drift. Every re-typed figure is a chance to transpose a digit, and the summary is precisely the artefact where a wrong number does the most damage.
Meanwhile the actual editorial question — which four numbers matter and what they mean — gets the least attention, because the mechanical work consumed the hour.
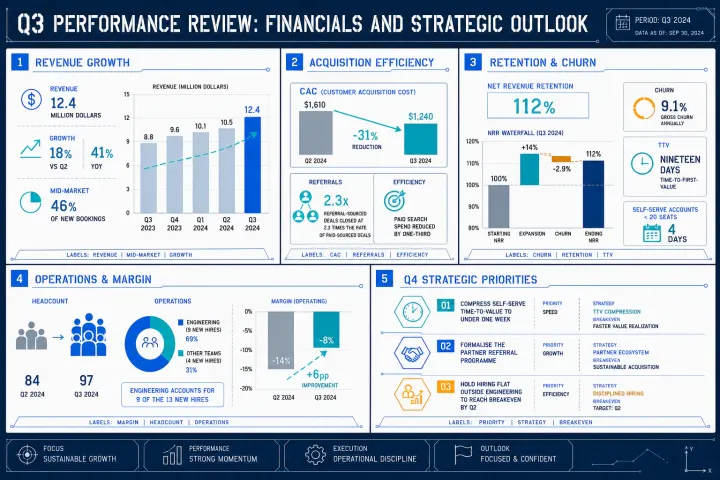
Numbers come from the report, not from memory
Everything on the page is pulled from the text you paste. There is no second spreadsheet to maintain and no re-typing step, which removes the most common way a summary goes wrong — a figure that was right in the appendix and wrong on the slide.
It also means the summary is cheap to redo. When the numbers get restated on the Thursday before the review, you paste the corrected text and generate again rather than reopening a deck and hunting for every place the old figure appeared. Because the layout was never positioned by hand, a changed input re-flows instead of breaking.
Choosing the shape of the argument
An executive summary is not one genre, it is several. A performance review wants a dashboard of tiles because the content is a set of independent readings. A strategy input wants a matrix, because the point is how four quadrants compare. A post-mortem wants dense modules, because the reader needs the timeline and the actions on the same page. A launch plan wants a route, because the content is a sequence with gates.
Picking the structure that matches the argument does most of the design work before anything is drawn. Where the content is genuinely a mixture, the dashboard shape is the safe default: discrete framed readings tolerate mixed material better than any layout that implies a single sequence.
- Quarterly and monthly business reviews
- Market studies and competitor scans
- Diligence and investment memos
- Project post-mortems and programme status
A look that survives a board pack
Internal documents have a register, and most AI-generated visuals miss it in the same direction: too playful, too illustrated, colours that belong in a consumer app. That is not a taste problem, it is a credibility problem — analysis presented like an advertisement gets read as an advertisement. Several of the available looks are deliberately restrained for exactly this reason: line work, muted colour, nothing decorative.
Set your organisation's exact colour and it holds across everything you generate, so a year of monthly one-pagers looks like it came from one team. That consistency is worth more internally than any single striking image: once readers stop decoding the format they start reading the content.
How to do it in about a minute
- 01
Paste the report
Drop in the document or paste the section that carries the findings. Thirty pages is well inside the limit.
- 02
Check the shape it came in with
The settings from this page are already applied: framed tiles in a restrained register, wide enough to drop straight into a slide.
- 03
Generate and circulate
The one-pager comes back in about a minute as a PNG — drop it into the deck, the email or the top of the doc.
Questions
Questions about business report to one-pager AI
It accepts up to 400,000 characters and works out which parts carry the findings. It is still a generative summary, so check the figures on the page against the source before circulating — the same review you would give a colleague's summary slide.
It frames metrics as labelled tiles rather than plotting live data. For a movement over time, put the figures in your text and choose a sequence layout; for real charts, keep the chart and use the one-pager for the summary around it.
Several of the available looks are built for it — line work and muted colour that read as analyst output rather than marketing. Set your own brand colour and a run of monthly one-pagers will look like a series instead of a set of one-offs.
Yes. Reuse the same preset and palette each cycle. The styling is declared, not hand-applied, so the format stays stable while the numbers change.
Your content is sent to the model to produce the image and your generation history is tied to your account. Treat it as you would any external AI service: for material under a strict confidentiality regime, paste a redacted version.
Build a one-pager
Paste your own text and the settings from this page are already applied. A free credit covers the first one.