The workbench
Compose your visual
Structure content into a labelled, multi-panel infographic
01Your content
0 / 400,000
Develop ideas into visuals · est. 2026
Text to visual summary in seconds. Paste an article, drop a PDF or Word doc, or hand us a link — Flowgraph reads it, works out the structure the content already has, and presses it into a publication-ready knowledge card, carousel, one-pager or banner — your palette, your language.
Sign up with Google and your first press is on us — a free credit, no credit card needed.
Input · plain text
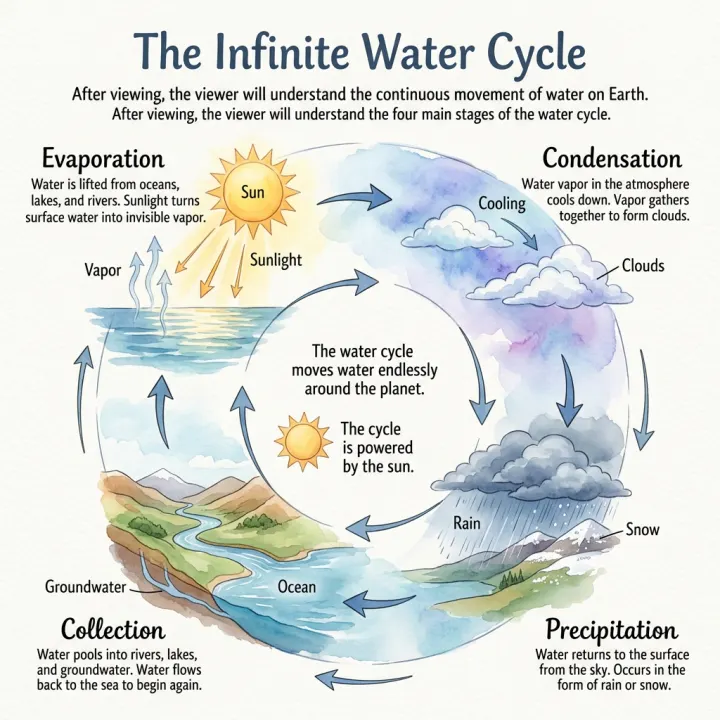
The water cycle moves water endlessly around the planet. Evaporation lifts water from oceans and lakes into the air as vapor. Condensation gathers that vapor into clouds. Precipitation returns it as rain or snow…
Output · visual summaryA closed loop — the last stage feeds the first
The workbench
Structure content into a labelled, multi-panel infographic
The specimen wall
Real infographics pressed from real content — every layout, every finish.
The old way
01
Canva or Figma still leave the structuring, aligning and styling to you — one infographic can swallow half a day of dragging boxes.
02
You end up rewriting your content to fit someone else's boxes, and the result still looks like the template.
03
The structure is in the writing. Flowgraph reads it and lays it out, instead of asking you to design it twice.
How it works
01
Drop in an article, a PDF or Word doc, or a URL. Flowgraph reads and structures it.
02
Pick the shape that matches your content and the register it should be read in, or leave both and let Flowgraph decide from the text.
03
A publication-ready infographic comes back in about a minute. Download and ship it.
What you get
A sequence comes back as a sequence, two options as a comparison, one idea with its dependencies as a hub — read off your text, not picked from a menu.
Paste text, drop a PDF, Word or Markdown file, or hand it a URL.
Set your exact brand colour once and every image in the series holds it, so a run of posts looks like one publication.
Write in one language and press the infographic in another.
An AI infographic generator only earns its keep if the result survives a glance. People scan web pages far more than they read them, so Flowgraph favours a clear structure and legible labels over cramming every detail onto the canvas — and every image comes back as a plain PNG you own, ready to drop into a post, a deck or a newsletter.
Top up
Each generation costs 1 credit. Sign up and get 1 free credit to start — top up any time. Credits never expire.
One-time payment in USD, processed securely by our payment provider. Prices exclude any applicable taxes. Credits are delivered immediately — using a credit waives the right to withdraw from that order. See our Refund Policy and Terms.
Questions
Flowgraph is an AI tool that turns text into visual summary cards. You paste an article, drop a PDF or Word doc, or hand it a URL, and it returns a structured, publication-ready visual — a knowledge card, a carousel, a one-pager or a banner — built from the content you gave it.
Yes. Sign up with Google and you get a free credit to generate your first visual summary — no credit card needed. After that it's pay-as-you-go credit packs, no subscription.
Paste raw text, drop in a PDF, Word doc, Markdown or plain-text file, or hand over a URL. Flowgraph reads the content, works out its structure, and presses it into a finished visual.
It works when your source is longer than the visual you want out of it — an article, a chapter, a report, a set of notes. Flowgraph reads it and decides what survives. It does not help if you are starting from a headline and a logo: there is nothing to compress, and a design editor will be faster.
Yes. Set your exact brand colour and it holds across everything you generate, so a series of posts or monthly reports looks like it came from one place rather than a different one each time.
Most images come back within a minute. You'll see the job move from queued to processing to done, and the result opens in a preview you can download.
Not in place — Flowgraph hands back a finished image, not an editable canvas. If something is off, adjust the source text or switch the layout or style and generate again; each generation uses one credit.
Paste it anyway. Flowgraph accepts up to 400,000 characters — far more than a long report — and works out which parts carry the structure rather than trying to fit every sentence onto the canvas. For tighter control, paste only the section you want visualised.
You keep ownership of the images you generate, so they can go anywhere your own artwork would — blog posts, decks, social cards, newsletters, print handouts. Downloads are PNGs, and nothing is watermarked, on free credits as well as paid ones.
A design tool hands you a canvas and expects you to decide what goes on it — you re-read your document, choose which points survive, and place them. Flowgraph does that editorial compression itself and hands back a finished image. The trade is control: there is no canvas to nudge, so corrections happen by editing your source text and generating again. If your input is much longer than your output, generating saves the most time; if it is a headline and a logo, a design editor is faster.
They are read from the text you paste, not invented from nothing and not pulled from a spreadsheet. It is still a generative model rendering a summary, so a figure can come through subtly wrong and a card can emphasise something your source treated as minor. Give anything you circulate a thirty-second check against the original — the same review you would give a colleague's summary slide.
Free to start — sign up with Google for a free credit. Paste your content and let Flowgraph press it into shape.
1 free credit on sign-up · No credit card needed