Templates · Executive summaries
SWOT Analysis Visual Template & Card Example
This SWOT analysis visual template was generated from an actual planning document — the kind with retention figures, churn concentration and named competitive threats in it — rather than from four lists of adjectives.
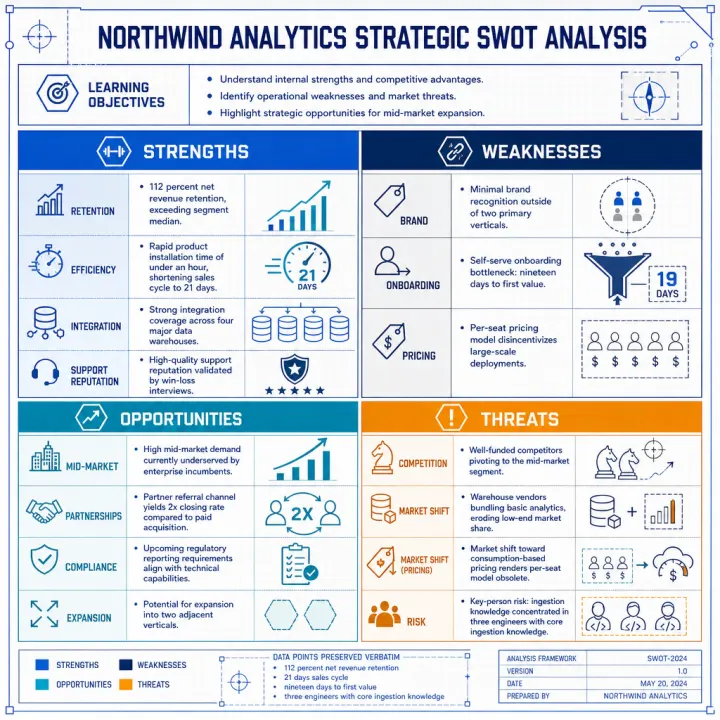
What this card carries
- Strengths and weaknesses stated with the numbers that justify them, not as adjectives
- Opportunities tied to specific observed behaviour, like a referral channel outperforming paid
- Threats including the structural ones — pricing model drift, key-person concentration
- A footer that lists the figures carried through from the source verbatim
The planning input this card was generated from
SWOT analysis — Northwind Analytics, planning input
Strengths. Net revenue retention of 112 percent, well above the segment median. A product that installs in under an hour, which shortens sales cycles to 21 days. Deep integration coverage across the four data warehouses our buyers actually use. A support reputation that shows up unprompted in win-loss interviews.
Weaknesses. Brand recognition outside our two strongest verticals is close to zero. Onboarding for self-serve accounts still takes nineteen days to first value, and churn concentrates there. Engineering is the only team with headroom; marketing has one generalist. Pricing is per-seat, which penalises exactly the wide-deployment accounts we most want.
Opportunities. Mid-market demand is growing faster than enterprise and is badly served by incumbents priced for large deployments. Partner referrals close at more than twice the rate of paid acquisition and currently run without a budget. Regulatory reporting requirements arriving next year create a compliance use case we already technically satisfy. Two adjacent verticals share our buyer persona.
Threats. Two well-funded competitors have moved down-market in the last two quarters. Warehouse vendors are bundling basic analytics into their platforms, which erodes the low end. Our per-seat pricing is increasingly out of step with a market moving to consumption models. Key-person concentration: three engineers hold most of the ingestion knowledge.
The strategic read: convert the retention strength and partner channel into mid-market share before the down-market competitors establish a brand there, and fix self-serve onboarding first because it is the cheapest lever on churn.
What a SWOT analysis visual template usually gets wrong
A SWOT grid is trivially easy to fill and usually worthless, because the four boxes accept adjectives. "Strong brand", "limited resources", "growing market", "competition" — four quadrants, no information, and nothing anyone can act on.
The fix happens before anything is drawn: every cell needs a fact attached. Retention at 112 percent is a strength; a good product is an opinion. Because this card is generated from the analysis text rather than typed into a template, the quality of the input is visible in the output — vague source text produces a visibly vague card, which is a useful forcing function.
The part that usually gets skipped
A SWOT is an input to a decision, not the decision. The version that earns its place on a one-pager ends with the strategic read: given these four boxes, what are we actually doing first?
The source text behind this example carries exactly that — convert the retention strength and the partner channel into mid-market share before the down-market competitors establish a brand, and fix self-serve onboarding first because it is the cheapest lever on churn. This particular render put its emphasis elsewhere, on a footer listing the figures it preserved verbatim, which is a fair illustration of how generation works: the structure is reliable, the exact emphasis varies between runs. If the strategic read has to appear, lead your source text with it.
Questions
Questions about this executive summary template
No. Northwind Analytics is a fictional company written to make the example concrete; the figures are illustrative. The structure and the workflow are real.
Yes. The structure does not care about scale — a product, a team or a career all fit the same four quadrants. Attach a fact to each cell and it works.
You get what your text supports, and the empty quadrant stays visibly empty. That is the useful outcome — a SWOT with no threats in it is a planning gap, not a design problem, and anything that quietly filled the space would hide the one thing worth noticing.
No — this is not a blank template you fill in, and the result is not an editable canvas. You paste the text you have already written, and Flowgraph renders it as a finished PNG. If something is wrong, change the source text or switch the style and generate again; each generation costs one credit.
Use this template with your own text
Not a blank template to fill in: you bring the writing, and this template's structure, style, aspect and palette are applied to it. What comes back is a finished image, not an editable canvas. One credit per image, and the first is free.