Templates · Executive summaries
Market Research Summary Template (Visual One-Pager)
This market research summary template turns a buyer survey into a dashboard of framed readings — the sample up front, the ranked decision drivers, and the reasons evaluations stall — because survey findings are independent readings rather than a sequence.
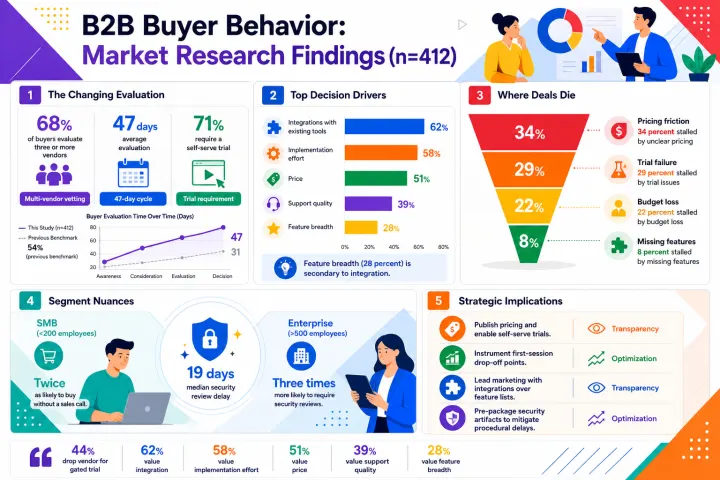
What this card carries
- The sample size carried into the title, so no figure gets read without it
- Decision drivers ranked with their percentages, integration ahead of price
- Where deals die, as its own block — unclear pricing, a failed trial, a lost champion
- Segment differences and the implications that follow from them
The research write-up this card was generated from
Market research summary — buyer survey, n=412
Sample. 412 responses from decision makers at companies of 50 to 1,000 employees, across four verticals, collected over five weeks. Response rate 11 percent. Median respondent seniority: director.
Headline findings. 68 percent of buyers evaluate three or more vendors before shortlisting, up from 54 percent two years ago. Average evaluation length is now 47 days. 71 percent say a self-serve trial is a requirement, not a preference, and 44 percent will drop a vendor that gates the trial behind a sales call.
What drives the decision. Ranked first by frequency: integration with existing tools, 62 percent. Then implementation effort, 58 percent. Then price, 51 percent. Then support quality, 39 percent. Feature breadth ranks fifth at 28 percent — buyers consistently rank fewer, better-integrated capabilities above longer feature lists.
Where deals die. 34 percent of stalled evaluations cite unclear pricing. 29 percent cite a failed or confusing trial. 22 percent cite an internal champion losing budget. Only 8 percent cite a missing feature.
Segment differences. Companies under 200 employees are twice as likely to buy without a sales conversation. Companies over 500 are three times more likely to require a security review, which adds a median of 19 days.
Implications. Publish pricing. Make the trial genuinely self-serve and instrument the first-session drop-off. Lead with integrations rather than feature counts. Pre-package the security review artefacts, because the delay is procedural, not technical.
This market research summary template leads with the sample
A research summary that opens with a headline percentage and hides the sample is asking to be over-read. Four hundred and twelve responses at an 11 percent response rate supports a directional claim; it does not support a decimal point.
Keeping the sample next to the headline — here it ends up in the title itself — is a small discipline with a large effect on how the numbers get used downstream. It is also the detail most likely to be dropped when a summary is rebuilt by hand under time pressure, which is one more reason to generate it from the text that already contains it.
The finding that changes what you build
The most useful block on this card is not the ranked drivers, it is where deals die. Only 8 percent of stalled evaluations cite a missing feature, while 34 percent cite unclear pricing and 29 percent a confusing trial — which points at the pricing page and the onboarding flow rather than the roadmap.
Giving that finding its own frame instead of a clause in paragraph nine is the whole reason to make a visual summary of research rather than forwarding the deck and hoping.
Questions
Questions about this executive summary template
No. The figures are illustrative, written to show what a complete research summary looks like. The structure and the workflow are real.
It frames the figures present in your text as labelled tiles; it does not read a spreadsheet or plot a dataset. Keep real charts as charts and use this for the summary around them.
The findings, not the whole report. Method notes and appendices compete for space with the numbers that matter, and there is room for roughly a dozen figures. A good test: paste the part you would say out loud in the first two minutes of the debrief.
No — this is not a blank template you fill in, and the result is not an editable canvas. You paste the text you have already written, and Flowgraph renders it as a finished PNG. If something is wrong, change the source text or switch the style and generate again; each generation costs one credit.
Use this template with your own text
Not a blank template to fill in: you bring the writing, and this template's structure, style, aspect and palette are applied to it. What comes back is a finished image, not an editable canvas. One credit per image, and the first is free.