Templates · Knowledge cards
Research Paper Visual Summary Card
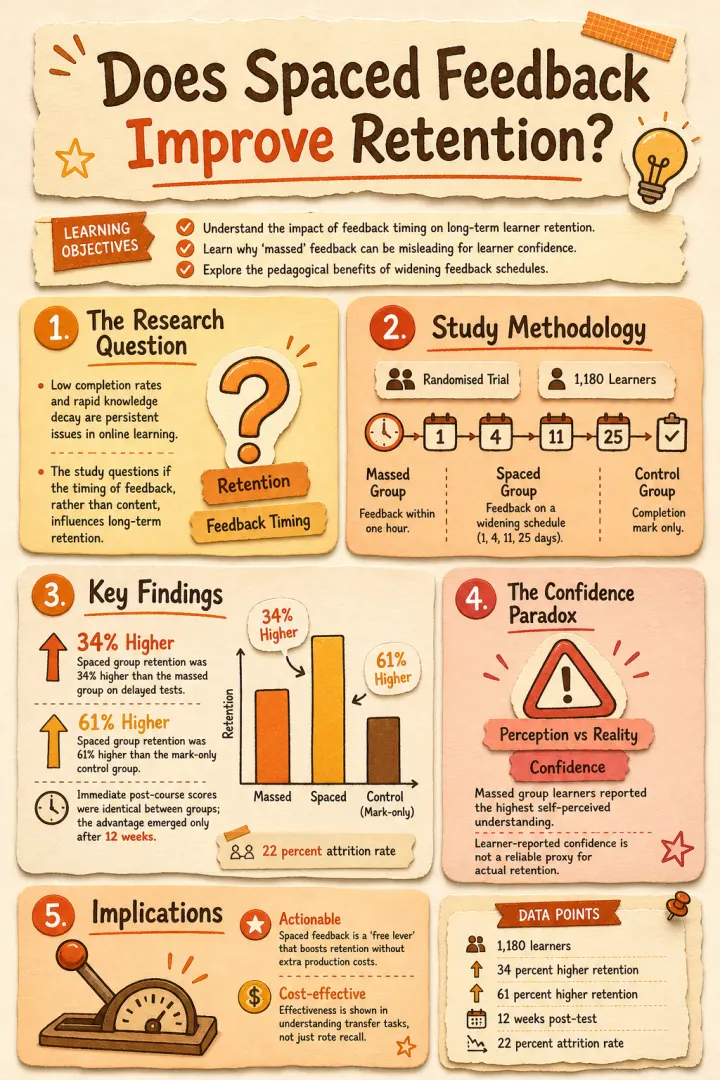
This research paper visual summary keeps the parts of a study separate on purpose — the question in one panel, the method in another, the findings in a third, the limitations beside them — so a reader can see what was actually shown before they see what it supposedly means.
What this card carries
- The research question stated as a question, not as a conclusion
- Method reduced to the four things that decide whether the result counts — design, sample, conditions, measure
- Findings carrying their own numbers, with the null result kept rather than dropped
- Limitations given equal space beside the findings, and one implication line closing the card
The paper summary this card was generated from
Paper summary — does spaced feedback improve retention in online courses?
Research question. Online course completion rates are low and knowledge decays quickly after the final assessment. The study asks whether the timing of feedback, rather than its content, changes how much learners retain three months later.
Method. A randomised trial with 1,180 learners across six introductory courses. All groups received identical written feedback on the same four assignments. The massed group received it within an hour of submission. The spaced group received it on a widening schedule — one day, four days, eleven days, twenty-five days. A control group received a completion mark only. Retention was measured by an unannounced test twelve weeks after course end, plus a delayed transfer task using unfamiliar problems.
Findings. Retention in the spaced group was 34 percent higher than the massed group on the delayed test, and 61 percent higher than the mark-only control. The gap widened on the transfer task, which suggests the effect is on understanding rather than recall of specific items. Immediate post-course scores were statistically indistinguishable between the two feedback groups — the advantage only appeared at twelve weeks. Learners in the massed group rated their own understanding highest of the three groups, and scored second.
Limitations. Single institution, introductory courses only, and a 22 percent attrition rate concentrated in the spaced condition, which may flatter its result. The delayed test was low-stakes and unincentivised. The study does not separate the effect of delay from the effect of repeated contact.
Implication. Feedback timing appears to be a free lever: the same feedback, delivered on a widening schedule, produced most of the measured gain at no additional cost. Learner-reported confidence is not a usable proxy for retention and moved in the opposite direction.
Why the limitations get a panel of their own
Most summaries of a paper are really summaries of its abstract, which means they inherit the abstract's job of selling the result. The caveats end up as a clause at the end of a sentence, if they survive at all, and the summary quietly becomes more confident than the study.
Giving limitations their own panel fixes that by construction. It costs the card nothing and it changes how the whole thing reads: attrition concentrated in one condition sits next to the headline number instead of underneath it. If you are summarising for a journal club, a literature review or a seminar, that panel is the one that will start the discussion.
Making a research paper visual summary from what you are reading
Paste your own summary rather than the paper itself. A few hundred words in your own words — what was asked, what was done, what came out, what it does not show — produces a far better card than the full text, because writing that paragraph is where the compression actually happens and you are better at it than any model.
For a literature review, do one card per paper and keep the same look across the set. Read side by side, the panels line up: you can compare methods across five studies without re-reading five papers, which is the part of a review that normally eats a week.
Questions
Questions about this knowledge card template
You can — PDFs are accepted directly. A hand-written summary usually produces a sharper card, because a full paper carries a lot of text that has no business on a single image and the model has to guess which parts you care about.
The figures are read from your text rather than recomputed, so they arrive as you wrote them. It is still a generative model rendering a summary, so give the numbers a thirty-second check against your source before you present the card — the same check you would give a colleague's slide.
As a section of one, yes. Downloads are full-resolution PNGs with no watermark and print cleanly. A full poster usually needs more than one card, so most people generate two or three and lay them out together.
No — this is not a blank template you fill in, and the result is not an editable canvas. You paste the text you have already written, and Flowgraph renders it as a finished PNG. If something is wrong, change the source text or switch the style and generate again; each generation costs one credit.
Use this template with your own text
Not a blank template to fill in: you bring the writing, and this template's structure, style, aspect and palette are applied to it. What comes back is a finished image, not an editable canvas. One credit per image, and the first is free.