Templates · Comparison charts
Comparison Chart Templates
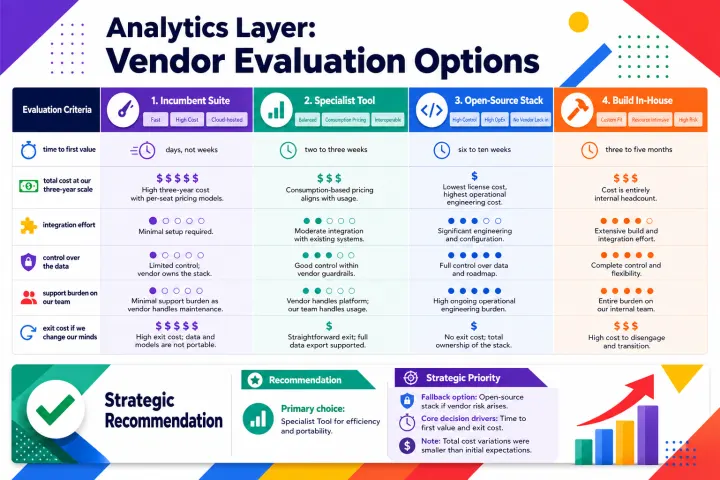
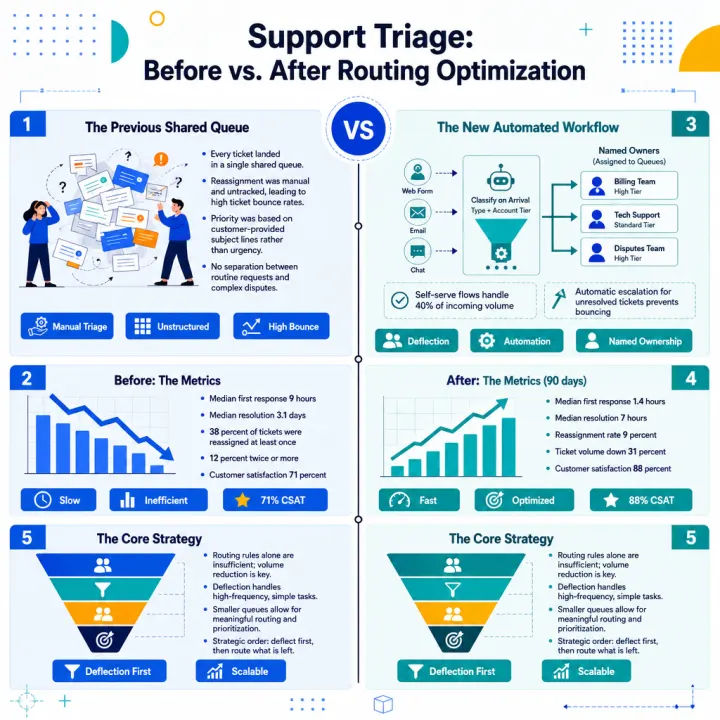
A comparison exists to end an argument, not to display data. Below are two finished examples — several options scored on shared criteria, and one process measured before and after a change — each generated from a real working document.
2 comparison charts, generated and shown in full
Why a comparison written as prose rarely persuades
The problem with comparing things in paragraphs is that the reader has to hold every option in their head at once and do the alignment themselves. By the third option they have forgotten what the first one scored on the criterion that matters to them, so they either re-read or, more often, defer.
A chart does the alignment for them. Every option is measured against the same criteria in the same order, which makes the gaps visible and — more usefully — makes the criteria arguable. Most stuck decisions are not disagreements about the options; they are unstated disagreements about which criteria should decide, and a chart is what drags that into the open.
Choose the shape by how many things you are comparing
Two is a different problem from four. Two things sit side by side and the reader compares them line by line, which is why before-and-after, old-versus-new and this-versus-that all want two columns. Three or more need a grid, because the reader is now scanning a column to rank options rather than reading two columns against each other.
- Two positions, states or moments → a two-column contrast
- Three or more options on shared criteria → a scored grid
- The same process measured before and after → two columns with matching rows
- Options that overlap rather than compete → circles that intersect
The rule that keeps a comparison honest
Every option must be measured on every criterion, including the ones where your preferred answer loses. A chart with a blank cell reads as an omission whether or not it was one, and a chart where one column wins every row reads as marketing — which is exactly the reaction you do not want in a decision meeting.
That is also why generating from your own evaluation notes works better than building the chart by hand. What gets drawn is what your text actually says, so the losing rows survive instead of quietly disappearing during layout.
Questions
Questions about comparison chart template
Four or five options against five or six criteria reads comfortably. Beyond that the cells get too small to hold a real assessment, and the honest fix is to cut the options that were never serious candidates rather than to shrink the type.
You can — the chart is built from the text you paste. Keep the claims to things you can support, and remember that a comparison you publish is one the other side may read. The examples here deliberately compare archetypes rather than named vendors for that reason.
No, and it should not. It draws the assessment your text contains. If your notes say an option is slow to deploy, that is what appears; nothing is inferred, ranked or invented on your behalf.
That is what they are for. Generate it, check the cells against your notes, and drop the image into the doc. Downloads are full-resolution PNGs with no watermark.
Elsewhere on Flowgraph
Make one from your own text
Pick the example closest to what you are summarising and paste your content — the recipe comes with it.