Templates · Comparison charts
Vendor Comparison Chart Template
This vendor comparison chart template puts four options against six criteria in one grid, including the rows where the recommended option loses, which is the difference between a comparison that settles a decision and one that reads as a pitch.
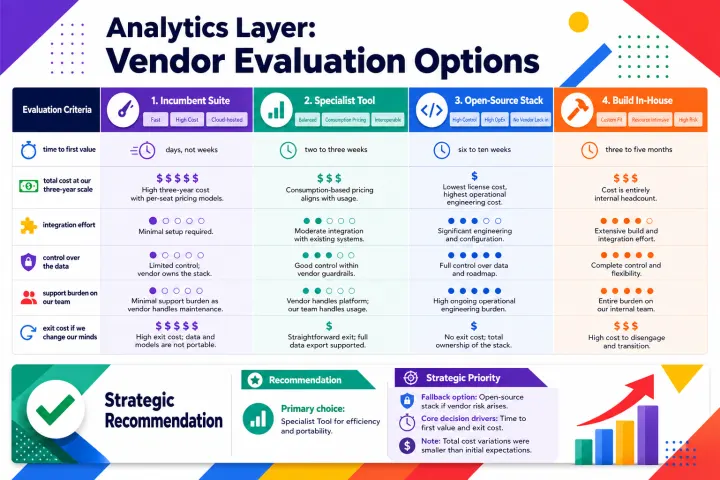
What this card carries
- Four options as columns, assessed on identical criteria so the gaps are readable down a row
- Criteria chosen for what decides the call — time to value, cost at scale, effort, control, support, exit
- Every cell filled, including the unflattering ones, because a blank reads as an omission
- A recommendation line naming which two criteria actually separated the field
The evaluation notes this chart was generated from
Vendor evaluation — four options for the analytics layer
We assessed four routes against six criteria that came out of the requirements workshop: time to first value, total cost at our three-year scale, integration effort, control over the data, support burden on our team, and exit cost if we change our minds.
Option one, the incumbent suite. Fastest to stand up — days, not weeks — and integrates with tools we already run. Highest three-year cost, and pricing is per-seat, which penalises exactly the wide internal rollout we want. Data stays in their cloud. Support is theirs, so the burden on us is minimal. Exit cost is high: the models are not portable.
Option two, the specialist tool. Two to three weeks to first value. Mid-range cost with consumption pricing that matches our usage shape. Strong on the reporting our finance team actually asks for, weak on the ad-hoc exploration analysts want. Small vendor, which is a support risk. Exit is straightforward — everything exports.
Option three, the open-source stack. Six to ten weeks before anything is usable. Lowest licence cost and highest operational cost; realistically one engineer's ongoing attention. Complete control over the data and the roadmap. Support is entirely our problem. No exit cost because there is nothing to exit.
Option four, build in-house. Three to five months. Cost is entirely people, and it competes directly with the product roadmap. Perfect fit by definition, and every future change is also our job. This is the option that looks cheapest and has the worst record of coming in on time.
Recommendation. The specialist tool, with the open-source stack as the fallback if the vendor risk materialises. Time to first value and exit cost are the two criteria that separated the field; cost differences were smaller than expected at our scale.
The criteria are the argument
Evaluations stall less often over the options than over which criteria should decide. One person is optimising for speed to launch, another for the cost of getting out again, and because neither says so, the debate runs in circles disguised as a discussion about features.
A grid ends that quietly. Once the criteria are named as row labels, disagreeing with them becomes the obvious move — and that disagreement is the conversation worth having. Most of a vendor comparison chart's value lands before anyone reads a single cell.
Building a vendor comparison chart from notes you already wrote
The input is the notes you took while assessing the options — a paragraph per option covering how it does on each criterion. No table, no scoring rubric, no spreadsheet. What you already wrote after the vendor calls is enough.
Because the cells come from your text rather than from a template's placeholder rows, the honest assessment survives layout. This example deliberately compares archetypes — an incumbent suite, a specialist, an open-source stack, building it yourself — rather than named vendors, which is also the safer shape for anything that leaves the building.
Questions
Questions about this comparison chart template
Four or five columns against five or six criteria is the readable limit. If you have eight candidates, the chart is not the problem — cut to the shortlist first, which is a decision the chart cannot make for you.
No. It renders the assessment in your text and does not compute a winner. That is deliberate: a chart that invents a score is worse than useless in a decision meeting, because the score is the first thing challenged.
Yes. Downloads are full-resolution PNGs with no watermark, and the restrained treatment on this example is the register internal documents are read in. Check the cells against your notes before circulating.
No — this is not a blank template you fill in, and the result is not an editable canvas. You paste the text you have already written, and Flowgraph renders it as a finished PNG. If something is wrong, change the source text or switch the style and generate again; each generation costs one credit.
More Comparison charts
Use this template with your own text
Not a blank template to fill in: you bring the writing, and this template's structure, style, aspect and palette are applied to it. What comes back is a finished image, not an editable canvas. One credit per image, and the first is free.