Templates · Comparison charts
Before and After Comparison Template
This before and after comparison template sets the two states side by side with matching rows — the same measures on the left as on the right — so a reader can see the size of the change instead of being told it was significant.
What this card carries
- The old process and the new one described in the same terms, line for line
- The same four measures on both sides, so every improvement is checkable
- The change that produced the result named explicitly, not implied by the numbers
- A closing note on what actually caused the shift — which was not the obvious part
The write-up this comparison was generated from
Support triage — before and after the routing change
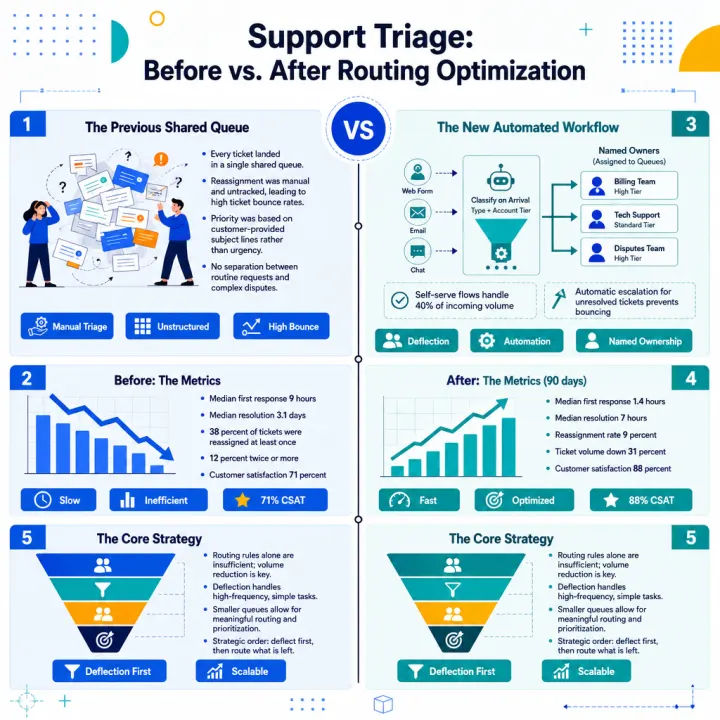
Before. Every incoming ticket landed in one shared queue. The first available agent read it, decided whether they could handle it, and either answered or reassigned. Reassignment was manual and untracked, so a ticket could bounce three times before reaching someone who could actually resolve it. Priority was whatever the customer typed in the subject line. There was no separation between a password reset and a billing dispute.
The numbers that came with it. Median first response 9 hours. Median resolution 3.1 days. 38 percent of tickets were reassigned at least once, and 12 percent twice or more. Customer satisfaction 71 percent. Agents reported spending roughly a third of their time reading tickets that were not theirs to answer.
After. Tickets are classified on arrival by type and account tier, then routed to a queue with a named owner. Three categories that made up 40 percent of volume — password resets, invoice copies, seat changes — are handled by self-serve flows and never create a ticket at all. Anything still unresolved after one reassignment escalates automatically rather than bouncing again. Priority is set by rule, not by adjective.
The numbers after ninety days. Median first response 1.4 hours. Median resolution 7 hours. Reassignment rate 9 percent. Customer satisfaction 88 percent. Ticket volume down 31 percent, almost entirely from the three self-serve categories.
What actually caused the change. Not the routing rules on their own — removing 40 percent of the volume is what made the remaining queue small enough for routing to matter. The order is worth stating plainly: deflect first, then route what is left.
What a before and after comparison template needs on both sides
Most before-and-after graphics compare a vague description of the old world with a specific description of the new one. The left column says "slow and manual"; the right says "1.4 hour first response". Readers notice, and the asymmetry undermines exactly the claim the image was made to support.
Symmetry fixes it at no cost. Whatever you measure on the right, measure on the left. If you do not have the before number, say so on the card rather than replacing it with an adjective — a stated gap is more persuasive than a confident vagueness.
Where this shape earns its place
Anywhere you need to show that something changed and survive the follow-up question: a process improvement write-up, a post-launch review, a case study, a pitch that turns on a migration, a retrospective slide that has to hold up in the room.
It also works for two positions that are not chronological — old policy against proposed policy, our approach against the common one, what people assume against what the data says. The format only needs two things being held against each other on shared terms.
Questions
Questions about this comparison chart template
Write that in your text and it appears as an unknown rather than an implied zero. A card that admits one missing baseline is far harder to argue with than one where the left column is all adjectives.
Two columns is what this shape is for. Three states usually want a sequence or a route instead, where the middle is a stage rather than a column being compared.
Yes, and the symmetry matters more when it is public. Keep every claim to something you could show, since a published before-and-after is the artefact readers check hardest.
No — this is not a blank template you fill in, and the result is not an editable canvas. You paste the text you have already written, and Flowgraph renders it as a finished PNG. If something is wrong, change the source text or switch the style and generate again; each generation costs one credit.
More Comparison charts
Use this template with your own text
Not a blank template to fill in: you bring the writing, and this template's structure, style, aspect and palette are applied to it. What comes back is a finished image, not an editable canvas. One credit per image, and the first is free.